NIMBioS Education and Outreach Modules
These modules were developed for NIMBioS Education and Outreach Programs and are freely available for educational use.
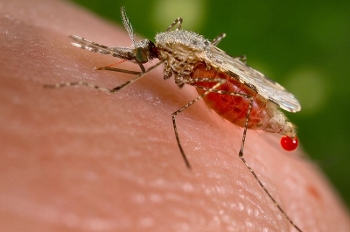 Using Linear Regression to Explore Environmental Factors Affecting Vector-borne Diseases.
In this activity students will use linear regression to analyze real data on vector-borne diseases and explore how environmental factors, such as climate change or population density, influence the transmission of these diseases. The activities are designed for face-to-face instruction and may be adapted for an online classroom.
Using Linear Regression to Explore Environmental Factors Affecting Vector-borne Diseases.
In this activity students will use linear regression to analyze real data on vector-borne diseases and explore how environmental factors, such as climate change or population density, influence the transmission of these diseases. The activities are designed for face-to-face instruction and may be adapted for an online classroom.
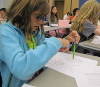 Spinners! Probability and Transitivity.
In this module, designed for grades 7-12, students explore probability and the relative property of transitivity. Transitivity can be used in any subject ranging from history to english to science to math.
This module will help show students that the transitive property has multiple facets, and does not always work they way one expects.
Spinners! Probability and Transitivity.
In this module, designed for grades 7-12, students explore probability and the relative property of transitivity. Transitivity can be used in any subject ranging from history to english to science to math.
This module will help show students that the transitive property has multiple facets, and does not always work they way one expects.
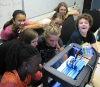 3-D Printing Models of Cell Organelles and Flowers.
Access to 3D printing has been a growing trend in K-12 schools. This hands-on module features active learning using 3-D printing technology to teach middle school students about physical models and and how they are used in science.
Students then design and print their own representations of cell organelles or flowers.
3-D Printing Models of Cell Organelles and Flowers.
Access to 3D printing has been a growing trend in K-12 schools. This hands-on module features active learning using 3-D printing technology to teach middle school students about physical models and and how they are used in science.
Students then design and print their own representations of cell organelles or flowers.
 Fossil Finder!
This module incorporates an educational computer game in which players collect fossils from different geologic eras, applying the fundamentals of scientific notation, exponent laws, and the concepts of stratigraphy, deep time, and the increasing complexity of life over time.
Developed for grades 6-8, as part of NIMBioS' SRE 2016 project Developing Computer Games for Teaching Biology.
Fossil Finder!
This module incorporates an educational computer game in which players collect fossils from different geologic eras, applying the fundamentals of scientific notation, exponent laws, and the concepts of stratigraphy, deep time, and the increasing complexity of life over time.
Developed for grades 6-8, as part of NIMBioS' SRE 2016 project Developing Computer Games for Teaching Biology.
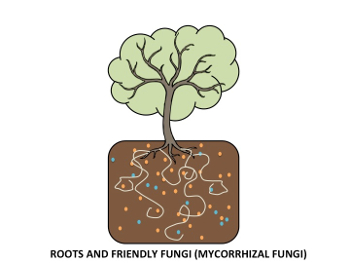 Fungus Among Us!
This module introduces the idea of how fungi and plants can work together in a symbiotic relationship, via a game that includes collecting data and graphing.
Developed as a fun and interactive exhibit at the 2014 USA Science & Engineering Festival, it is designed for kids, adults, and families to be shared in an informal environment.
Fungus Among Us!
This module introduces the idea of how fungi and plants can work together in a symbiotic relationship, via a game that includes collecting data and graphing.
Developed as a fun and interactive exhibit at the 2014 USA Science & Engineering Festival, it is designed for kids, adults, and families to be shared in an informal environment.
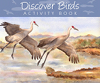 Discover Birds! Changing Populations and Birds Champions.
This module uses real data from the North American Breeding Bird Survey to find out what's happening to Tennessee populations of Eastern Bluebird, Wild Turkey and Northern Bobwhite over time. In a second activity, solve arithmetic problems to discover which North American birds are the tallest, fastest, and more! Developed for grades 4-6.
Discover Birds! Changing Populations and Birds Champions.
This module uses real data from the North American Breeding Bird Survey to find out what's happening to Tennessee populations of Eastern Bluebird, Wild Turkey and Northern Bobwhite over time. In a second activity, solve arithmetic problems to discover which North American birds are the tallest, fastest, and more! Developed for grades 4-6.
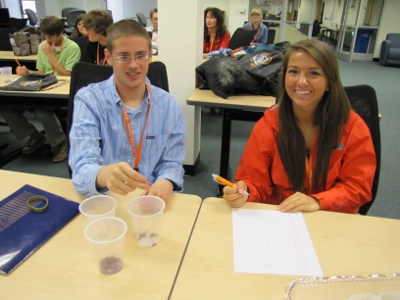 The Mathematics of Understanding Disease.
In this module,
students use beans in a cup to simulate a disease outbreak and learn how mathematical disease models are created. In a second activity, students use real world health data and a computer data visualization tool to discover trends about malaria.
Designed with NIMBioS collaborator Hands On for grades 9-12; may be adapted to lower grades.
The Mathematics of Understanding Disease.
In this module,
students use beans in a cup to simulate a disease outbreak and learn how mathematical disease models are created. In a second activity, students use real world health data and a computer data visualization tool to discover trends about malaria.
Designed with NIMBioS collaborator Hands On for grades 9-12; may be adapted to lower grades.
 Writing the Abstract.
This module introduces what an abstract is, explains why it is important to write it well, and provides general guidelines and abstract writing strategies. The module includes a worksheet file and an online PREZI presentation about abstract preparation. This module was created by NIMBioS for undergraduate and graduate students, but could be used by anyone interested in tips on abstract writing.
Writing the Abstract.
This module introduces what an abstract is, explains why it is important to write it well, and provides general guidelines and abstract writing strategies. The module includes a worksheet file and an online PREZI presentation about abstract preparation. This module was created by NIMBioS for undergraduate and graduate students, but could be used by anyone interested in tips on abstract writing.
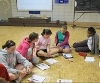 Measuring Biodiversity.
In this module, students learn the ecologists' definition of biodiversity, and also two ways an area's tally of organisms can differ: species richness and species evenness. Then, using hypothetical examples of insect data, they create a hypothesis and apply Simpson's Index of Biodiversity to test their hypothesis. Designed for grades 6 and up.
Measuring Biodiversity.
In this module, students learn the ecologists' definition of biodiversity, and also two ways an area's tally of organisms can differ: species richness and species evenness. Then, using hypothetical examples of insect data, they create a hypothesis and apply Simpson's Index of Biodiversity to test their hypothesis. Designed for grades 6 and up.
 Measuring a Forest.
In this module, students learn about
the area and distribution of forests in the United States and why it is
important to measure and monitor forests. Two important measurements
students learn about are DBH (Diameter at Breast Height), a measurement
of tree trunk diameter, and forest stand density. Students create their own DBH tapes and test them on tree "cookies." Designed for grades 6 and up.
Measuring a Forest.
In this module, students learn about
the area and distribution of forests in the United States and why it is
important to measure and monitor forests. Two important measurements
students learn about are DBH (Diameter at Breast Height), a measurement
of tree trunk diameter, and forest stand density. Students create their own DBH tapes and test them on tree "cookies." Designed for grades 6 and up.
 Modeling Predator-Prey Relationships in Soil.
In this module, students
define the terms predator and prey and identify examples from soil
ecology. They
create a hypothesis about how prey numbers will affect a predator
population, use a mathematical model to perform calculations
that will either support or refute their hypothesis, and create and interpret a graph of results. Designed for grades 9 and up.
Modeling Predator-Prey Relationships in Soil.
In this module, students
define the terms predator and prey and identify examples from soil
ecology. They
create a hypothesis about how prey numbers will affect a predator
population, use a mathematical model to perform calculations
that will either support or refute their hypothesis, and create and interpret a graph of results. Designed for grades 9 and up.
Education and Outreach Contacts
Suzanne Lenhart
Associate Director for Education and Outreach
Email: slenhart@tennessee.edu
Ph: (865) 974-4270 (Math) (865) 974-9349 (NIMBioS) Fax: (865) 974-9300
National Institute for Mathematical and Biological Synthesis
University of Tennessee
1122 Volunteer Blvd., Suite 106
Knoxville, TN 37996-3410
NIMBioS
1122 Volunteer Blvd., Suite 106
University of Tennessee
Knoxville,
TN 37996-3410
PH: (865) 974-9334
FAX: (865) 974-9461
Contact NIMBioS